
Revisions · arXiv preprint
Opponent-Adjusted Evaluation of NFL Pass Blocking and Pass Rushing Performance
Interpretable paired-comparison models for pass protection and pass rush
Public research on interpretable blocker and rusher ratings built from sparse, opponent-dependent tracking interactions.
Public working paper
This project is reported in Opponent-Adjusted Evaluation of NFL Pass Blocking and Pass Rushing Performance by Jonathan Pipping-Gamón, Maximilian J. Gebauer, Victoria Lee, Kenny Watts, and Abraham J. Wyner. The paper and full authorship are public on arXiv, and the complete analysis pipeline is available in the linked GitHub repository. The manuscript is currently in revisions.
The question
Pass rush and pass protection are relational: an observed result reflects both players in the matchup as well as help structure and play context. Conventional summaries struggle with this problem because sacks and hits are rare, while a blocker can succeed without producing a direct box-score event. How can a model separate the two opponents’ contributions without pretending that every player has equally complete evidence?
Data and method
Using 2021 regular-season Hudl tracking data, the study constructs 153,138 labeled blocker-rusher interactions from 33,283 pass plays in 266 games. It estimates separate ridge-regularized Bradley-Terry models for two views of each interaction: a binary win/loss outcome aligned with the 2.5-second pass-block win-rate definition, and a four-class severity outcome distinguishing loss, win, quarterback hit, and sack. Both models include a double-team indicator.
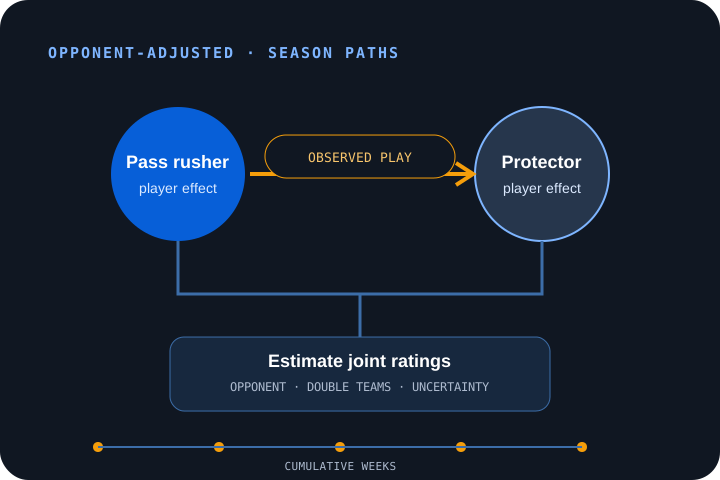
Ridge shrinkage stabilizes player estimates when exposure is sparse and the matchup graph is incomplete. The two players enter the model with opposing effects, producing role-specific but jointly estimated ratings. Cumulative weekly fits show how estimates and their uncertainty develop as the season’s evidence accumulates; they are descriptive paths rather than a claim that the model identifies a player’s changing underlying ability.
Validation and findings
The evaluation uses an ordered 80/20 holdout, preserving the later portion of the interaction table for testing. Each model is compared with both a global baseline and a stronger matchup baseline constructed from smoothed player histories. On the 30,628-interaction test set, both models improve on the global baselines and modestly outperform the matchup baselines under log-loss evaluation, with relative reductions ranging from approximately 0.24% to 1.21%.
Those gains are deliberately described as modest. Game-level bootstrap resampling indicates the clearest stability for the binary win model and for the severity model relative to its global baseline. The severity model’s advantage over the stronger matchup baseline remains directionally positive but less certain. Comparison with 2021 AP All-Pro selections supplies an additional face-validity check, with the severity ratings showing the strongest alignment; expert recognition is informative here, but it is not a gold-standard performance label.
Contribution and boundaries
The central contribution is methodological: an interpretable way to estimate blockers and rushers together while adjusting for opponent strength, uneven exposure, and an observed form of help. The binary and severity models answer related but distinct questions instead of compressing every engagement into one opaque score.
The framework also has clear limits. The win label is an operational proxy for functional pressure; the double-team indicator cannot fully represent protection slides or chip help; and quarterback time-to-throw, play design, teammate effects, and role specialization remain only partially represented. The analysis covers one regular season, so the learned rankings should not be treated as timeless measures of player ability. Those limits motivate richer labels, hierarchical structure, and multi-season pooling in future work.
The conceptual visual above explains the model structure without duplicating the paper’s empirical figures. The arXiv preprint remains the canonical source for numerical results, and the public repository documents the reproducible R pipeline.